Symptoms
When a pool member goes down on an F5 BIG-IP, the most visible indicator is traffic interruption or degraded application availability. Depending on your pool's load-balancing configuration and the number of remaining healthy members, users may experience connection timeouts, HTTP 503 Service Unavailable errors, or inconsistent application responses as surviving members absorb the additional load.
Common symptoms include:
- The BIG-IP Dashboard or Local Traffic Manager GUI shows one or more pool members highlighted in red (down) or yellow (unavailable)
- TMSH or the GUI reports the pool member status as offline or forced offline
- Application performance monitoring alerts fire for the virtual server backed by the affected pool
- The
/var/log/ltm
log on the BIG-IP contains health monitor failure messages referencing the member IP and port - End users report intermittent or complete inability to reach a service hosted behind the virtual server
- Load balancing statistics show zero new connections being sent to the affected member
- iHealth or SNMP polling shows pool availability below 100%
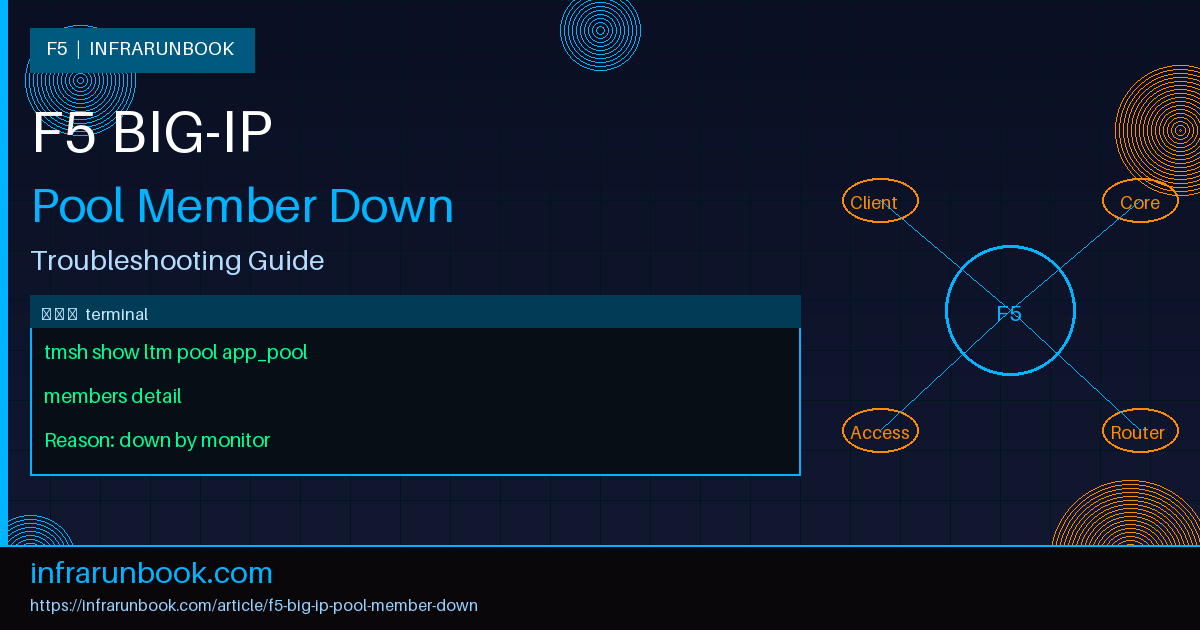
The first step in every investigation is to confirm the member's exact status using TMSH:
tmsh show ltm pool app_pool members detailLtm::Pool Member: app_pool/10.10.2.10:80
Status
Availability : offline
State : enabled
Reason : Pool member has been marked down by a monitor
Statistics
Serverside Bits In : 0
Serverside Bits Out : 0
Total Connections : 0
Current Connections : 0The Reason field is the most important line — it tells you immediately whether the problem is a monitor failure, an administrative action, or a connection-level issue. Everything else in this guide flows from interpreting that field correctly.
Root Cause 1: Health Monitor Failure
Why It Happens
F5 BIG-IP uses health monitors to continuously probe pool members and verify they are capable of serving traffic. When a monitor probe fails — because the backend returns an unexpected response, the
recvstring does not match the actual response body, the probe times out, or the monitored URL has changed — BIG-IP marks the member as down and stops sending new connections to it.
The most common monitor types are HTTP, HTTPS, TCP, ICMP, and custom EAV (External Application Verification) monitors. A monitor can begin failing after a seemingly unrelated backend change: for example, a deployment that changes the health-check endpoint from
/healthto
/healthz, or an application update that begins returning
302 Foundinstead of
200 OK.
How to Identify It
Check the LTM log for monitor-related state change messages:
tail -f /var/log/ltm | grep -i "monitor"Apr 04 09:12:33 bigip01 mcpd[5012]: 01070638:5: Pool /Common/app_pool member /Common/10.10.2.10:80 monitor status down. [ /Common/http_monitor: down ] [ was up for 3days 4hrs:22min:11sec ]Inspect the current monitor configuration attached to the pool:
tmsh list ltm monitor http http_monitorltm monitor http http_monitor {
defaults-from http
interval 5
recv "HTTP/1.1 200"
send "GET /health HTTP/1.1\r\nHost: solvethenetwork.com\r\nConnection: close\r\n\r\n"
timeout 16
}Manually simulate the probe from the BIG-IP shell to see exactly what the backend returns:
curl -v -H "Host: solvethenetwork.com" http://10.10.2.10:80/health* Connected to 10.10.2.10 (10.10.2.10) port 80
> GET /health HTTP/1.1
> Host: solvethenetwork.com
< HTTP/1.1 301 Moved Permanently
< Location: /healthzThe backend now redirects
/healthto
/healthz, returning a
301— but the monitor's
recvstring expects
HTTP/1.1 200, so every probe fails.
How to Fix It
Update the monitor's
sendand
recvstrings to match the backend's current behavior:
tmsh modify ltm monitor http http_monitor send "GET /healthz HTTP/1.1\r\nHost: solvethenetwork.com\r\nConnection: close\r\n\r\n"
tmsh modify ltm monitor http http_monitor recv "200 OK"
tmsh save sys config
After saving, wait one monitor interval (5 seconds in this example) and verify the member recovers:
tmsh show ltm pool app_pool members detail | grep -A5 "10.10.2.10" Availability : available
State : enabled
Reason : Pool member is availableRoot Cause 2: Port Closed on Backend
Why It Happens
If the service on the backend server stops listening on the configured port — due to a crashed application process, a failed deployment, a systemd unit that did not restart after a server reboot, or a host-based firewall rule change — BIG-IP's TCP-based health monitors will fail because the TCP SYN is met with a RST (connection refused) or simply times out. The pool member is marked down within a single monitor timeout cycle.
How to Identify It
From the BIG-IP, attempt a direct TCP connection to the pool member port:
bash -c "echo > /dev/tcp/10.10.2.10/80" && echo "Port open" || echo "Port closed"Port closedOr use curl with a short connect timeout:
curl -v --connect-timeout 5 http://10.10.2.10:80/* connect to 10.10.2.10 port 80 failed: Connection refused
curl: (7) Failed to connect to 10.10.2.10 port 80: Connection refusedLog into the backend server and verify whether anything is listening on the expected port:
ss -tlnp | grep :80# No output — nothing is bound to port 80Check the service status directly:
systemctl status nginx● nginx.service - A high performance web server
Loaded: loaded (/lib/systemd/system/nginx.service; enabled; vendor preset: enabled)
Active: failed (Result: exit-code) since Fri 2026-04-04 08:55:01 UTC; 17min ago
Process: 21043 ExecStart=/usr/sbin/nginx (code=exited, status=1/FAILURE)
Apr 04 08:55:01 sw-infrarunbook-01 nginx[21043]: nginx: [emerg] bind() to 0.0.0.0:80 failed (98: Address already in use)How to Fix It
Identify and resolve the port conflict, then restart the service:
ss -tlnp | grep :80
# Find and kill the conflicting process, then:
systemctl restart nginx
systemctl status nginx
If a host-based firewall is blocking inbound connections from the BIG-IP self IP, add a rule to permit it:
firewall-cmd --permanent --add-rich-rule='rule family="ipv4" source address="10.10.1.1" port protocol="tcp" port="80" accept'
firewall-cmd --reload
After the service is restored and the port is open, the BIG-IP health monitor will detect the restored service within the next monitor interval and re-enable the pool member automatically — no manual intervention on the BIG-IP is required.
Root Cause 3: Routing Issue
Why It Happens
F5 BIG-IP sends health monitor probes and routes return traffic from its self IP addresses. If the network path between the BIG-IP self IP and the pool member's subnet is broken — because a static route was accidentally deleted, a next-hop gateway is unreachable, a VLAN trunk is misconfigured, or a Layer 3 switch lost its routing table entry after a reload — probes will time out and the member will be marked down. This scenario is especially common immediately following a network maintenance window, a firewall policy change, or a VLAN reconfiguration.
How to Identify It
From the BIG-IP, ping the pool member using the self IP as the source interface:
ping -c 4 -I 10.10.1.1 10.10.2.10PING 10.10.2.10 (10.10.2.10) from 10.10.1.1 : 56(84) bytes of data.
From 10.10.1.1 icmp_seq=1 Destination Host Unreachable
From 10.10.1.1 icmp_seq=2 Destination Host Unreachable
--- 10.10.2.10 ping statistics ---
4 packets transmitted, 0 received, +4 errors, 100% packet lossInspect the BIG-IP routing table for the backend subnet:
tmsh show net routeNet::Routes
Name Dest Gateway Type MTU
/Common/default_route 0.0.0.0/0 10.10.1.254 gw 0The route for
10.10.2.0/24is absent — all traffic destined for the backend pool is being sent to the default gateway, which may not know how to reach that subnet. Verify that the gateway itself is reachable:
ping -c 4 10.10.1.254Also confirm that the correct VLAN and self IP configuration is in place:
tmsh list net vlan
tmsh list net self
net self bigip_self_backend {
address 10.10.2.1/24
vlan vlan-backend
allow-service default
}If the self IP on the backend VLAN is missing, that is the root cause.
How to Fix It
Add the missing static route for the backend subnet:
tmsh create net route backend_subnet network 10.10.2.0/24 gw 10.10.1.254
tmsh save sys config
Or, if the self IP was deleted, recreate it:
tmsh create net self bigip_self_backend address 10.10.2.1/24 vlan vlan-backend allow-service default
tmsh save sys config
After restoring connectivity, confirm end-to-end reachability before relying on the monitor to bring the member back up:
ping -c 4 -I 10.10.2.1 10.10.2.10Root Cause 4: SSL Handshake Failure
Why It Happens
When pool members serve HTTPS and the BIG-IP uses an HTTPS health monitor or a server-side SSL profile for encrypted backend traffic, an SSL handshake failure will prevent the monitor from completing successfully. The most common triggers are: an expired or untrusted certificate on the backend server, a cipher suite or TLS protocol version mismatch between the BIG-IP server SSL profile and the backend, an SNI hostname not being sent (causing the backend to present the wrong certificate), or a certificate chain that is incomplete and cannot be verified.
How to Identify It
Search the LTM log for SSL-related failure messages:
grep -i "ssl\|handshake\|certificate\|cipher" /var/log/ltm | tail -30Apr 04 10:04:17 bigip01 tmm[18500]: 01260009:4: 10.10.1.1:0 -> 10.10.2.11:443: Connection error: ssl_hs_rxhello:40: no shared ciphers (80)
Apr 04 10:04:17 bigip01 mcpd[5012]: 01070638:5: Pool /Common/app_pool member /Common/10.10.2.11:443 monitor status down. [ /Common/https_monitor: down ]Simulate the SSL handshake manually from the BIG-IP shell to see the exact negotiation failure:
openssl s_client -connect 10.10.2.11:443 -servername solvethenetwork.comCONNECTED(00000003)
140736354121536:error:14077410:SSL routines:SSL23_GET_SERVER_HELLO:sslv3 alert handshake failure:s23_clnt.c:802:
---
no peer certificate available
---
No client certificate CA names sentVerify certificate validity and expiry on the backend directly:
echo | openssl s_client -connect 10.10.2.11:443 -servername solvethenetwork.com 2>/dev/null | openssl x509 -noout -dates -subjectsubject=CN=solvethenetwork.com
notBefore=Jan 1 00:00:00 2025 GMT
notAfter=Mar 31 23:59:59 2026 GMTAn expired
notAfterdate, a mismatched CN, or the cipher mismatch error above all point to this root cause.
How to Fix It
If the backend certificate is expired, renew and reinstall it on the backend server, then restart the service. If the problem is a cipher or TLS version mismatch, update the BIG-IP server SSL profile to include compatible options:
tmsh modify ltm profile server-ssl serverssl-backend ciphers "DEFAULT:!RC4:!3DES:!EXPORT"
tmsh modify ltm profile server-ssl serverssl-backend options { dont-insert-empty-fragments }
tmsh save sys config
If the HTTPS monitor is rejecting self-signed certificates on internal backend servers, enable compatibility mode on the monitor (acceptable only in trusted internal network segments):
tmsh modify ltm monitor https https_monitor compatibility enabled
tmsh save sys config
If the issue is an incorrect or missing SNI hostname, update the monitor to send the correct SNI value and Host header:
tmsh modify ltm monitor https https_monitor ssl-profile /Common/serverssl-backend
tmsh modify ltm monitor https https_monitor send "GET /health HTTP/1.1\r\nHost: solvethenetwork.com\r\nConnection: close\r\n\r\n"
tmsh save sys config
Root Cause 5: Backend Overloaded
Why It Happens
A backend server under extreme CPU, memory, or connection pressure may respond to health monitor probes too slowly, causing the BIG-IP monitor to time out before receiving a valid response. BIG-IP then marks the pool member as down even though the server process is still running — it is simply too saturated to respond within the configured
timeoutwindow. This pattern is common during traffic spikes, memory leaks in long-running application processes, or runaway background jobs that starve the main application thread.
How to Identify It
Search the LTM log for timeout-specific monitor failure messages:
grep -i "timeout\|timed out\|no response\|recv timeout" /var/log/ltm | tail -20Apr 04 11:30:44 bigip01 mcpd[5012]: 01070638:5: Pool /Common/app_pool member /Common/10.10.2.10:8080 monitor status down. [ /Common/http_monitor: down ] recv timeoutNotice the key difference: the message says recv timeout, not a connection refused error. The TCP connection succeeded but the application never sent a complete response. Log into the backend server to confirm resource saturation:
top -bn1 | head -5top - 11:31:02 up 14 days, 22:14, 1 user, load average: 47.32, 45.91, 38.10
Tasks: 512 total, 3 running, 509 sleeping
%Cpu(s): 99.8 us, 0.1 sy, 0.0 ni, 0.0 id, 0.0 wa, 0.0 hi, 0.1 si
MiB Mem : 7872.0 total, 112.4 free, 7680.3 used, 79.3 buff/cacheCheck the current TCP connection count:
ss -sTotal: 8450
TCP: 8449 (estab 8200, closed 130, orphaned 45, timewait 130)Over 8000 established TCP connections on a single backend node is a strong indicator of resource saturation and explains why health monitor probes are timing out.
How to Fix It
In the short term, administratively disable the overloaded member to prevent additional connections from being sent to it, allowing it to drain and recover:
tmsh modify ltm pool app_pool members modify { 10.10.2.10:8080 { state user-down } }Investigate and remediate the root cause on the backend (kill runaway processes, clear connection backlog, increase JVM heap, add horizontal capacity). Once the server has recovered, re-enable the member:
tmsh modify ltm pool app_pool members modify { 10.10.2.10:8080 { state user-up } }For sustained mitigation, increase the monitor timeout to reduce false positives during brief spikes, and set a connection limit on the pool member to prevent future overload:
tmsh modify ltm monitor http http_monitor timeout 31 interval 10
tmsh modify ltm pool app_pool members modify { 10.10.2.10:8080 { connection-limit 2000 } }
tmsh save sys config
Root Cause 6: Node Disabled or Forced Offline
Why It Happens
BIG-IP distinguishes between pool member state and node state. An administrator can manually disable a node (affecting all pool members using that IP across all pools) or force a specific pool member offline during a maintenance window. If the member or node is accidentally left in a disabled or forced-offline state after maintenance concludes, it will continue to appear down in the pool even though the backend server is perfectly healthy and passing health checks.
How to Identify It
The State field in the member detail output is the giveaway — it will read
disabledrather than
enabled:
tmsh show ltm pool app_pool members detail | grep -A8 "10.10.2.10"Ltm::Pool Member: app_pool/10.10.2.10:80
Status
Availability : offline
State : disabled
Reason : Pool member does not have service down rules applied (or was manually disabled)Also check whether the node itself is disabled at the node level:
tmsh show ltm node 10.10.2.10Ltm::Node: 10.10.2.10
Status
Availability : unknown
State : disabled
Reason : Node address is disabledHow to Fix It
Re-enable the specific pool member:
tmsh modify ltm pool app_pool members modify { 10.10.2.10:80 { state user-up } }
tmsh save sys config
Or, if the node itself was disabled, re-enable it at the node level (this affects all pools using this IP):
tmsh modify ltm node 10.10.2.10 state user-up
tmsh save sys config
Root Cause 7: ARP or Layer 2 Reachability Issue
Why It Happens
At Layer 2, if the BIG-IP cannot resolve the MAC address of a pool member — because the ARP entry has staled, the switch MAC address table has not been updated after a NIC replacement, or a virtual machine was live-migrated to a different hypervisor host — health monitor probes fail at the network layer before ever reaching the application. This is more prevalent in virtualized environments using VMware vMotion or similar live-migration technologies.
How to Identify It
Check the BIG-IP ARP table for the pool member's IP address:
tmsh show net arp | grep 10.10.2.1010.10.2.10 pending - vlan-backendA pending state means ARP requests are being sent but no reply is being received — the MAC address cannot be resolved. This is distinct from a stale but populated entry, which indicates the MAC was known but may now be incorrect.
How to Fix It
Force an ARP refresh by deleting the stale entry and triggering a new ARP probe:
tmsh delete net arp 10.10.2.10
ping -c 3 -I 10.10.2.1 10.10.2.10
tmsh show net arp | grep 10.10.2.10
10.10.2.10 resolved 00:50:56:ab:12:34 vlan-backendIf the issue persists, verify VLAN tagging on the switch port connected to sw-infrarunbook-01 that trunks the backend VLAN to both the BIG-IP and the hypervisor host where the VM now resides. Confirm the MAC appears in the switch's forwarding table on the correct port after the migration.
Prevention
Preventing pool member outages requires proactive monitoring, correct initial configuration, and strict operational discipline around change windows. The following practices materially reduce the frequency and blast radius of pool member down events in production:
- Validate health monitors before deployment: Always test the monitor's
send
andrecv
strings manually usingcurl
oropenssl
from the BIG-IP shell before attaching any monitor to a production pool. A monitor that passes QA in staging may behave differently against production backends. - Set realistic monitor intervals and timeouts: The default 5-second interval and 16-second timeout is often too aggressive for loaded Java or Python backends. Profile your application's 99th-percentile response time under peak load and set the timeout to at least three times that value.
- Configure minimum-members-active: Use the pool's
min-active-members
setting so that if remaining healthy members drop below a safe threshold, the virtual server is taken offline rather than overloading a single surviving backend. - Enforce per-member connection limits: Set
connection-limit
on pool members to prevent individual backends from accepting more connections than they can serve, which avoids the monitor timeout pattern caused by backend overload. - Monitor TLS certificate expiry: Use an iCall script or external monitoring platform to alert when certificates on backend pool members are within 30 days of expiry. Never let an SSL handshake failure be the first notification of an expired certificate.
- Document and audit maintenance procedures: Maintain a runbook for disabling and re-enabling pool members. Require sign-off or an automated re-enable script with a timeout so members cannot be left in a forced-offline state indefinitely.
- Centralize syslog and alert on state changes: Configure BIG-IP to forward syslog to a SIEM or alerting platform and create alerts for message ID
01070638
(pool member state change). This provides real-time visibility without relying on dashboard polling. - Validate routing after every network change: Include a post-change test step in all network maintenance runbooks that pings each BIG-IP pool member from each relevant self IP before closing the change window.
- Use slow ramp time for recovered members: Configure
slow-ramp-time
on pools so that a member returning to service receives gradually increasing traffic rather than an immediate flood, reducing the chance of immediate re-overload.