HAProxy is trusted to proxy millions of requests per second in production environments, but raw throughput means little if you cannot observe what is happening inside the proxy at any given moment. HAProxy ships with three complementary observability mechanisms: a built-in HTTP statistics dashboard, a Unix socket Runtime API for real-time inspection and live configuration changes, and a highly configurable logging subsystem that integrates with any syslog-compatible collector. Together, these tools give operators full visibility into traffic patterns, backend health, and session state without ever restarting the service.
This article walks through configuring all three mechanisms on a production HAProxy 2.8 LTS installation running on sw-infrarunbook-01, explains the most important metrics exposed by each, and demonstrates how to integrate HAProxy telemetry with Prometheus for long-term trending and alerting.
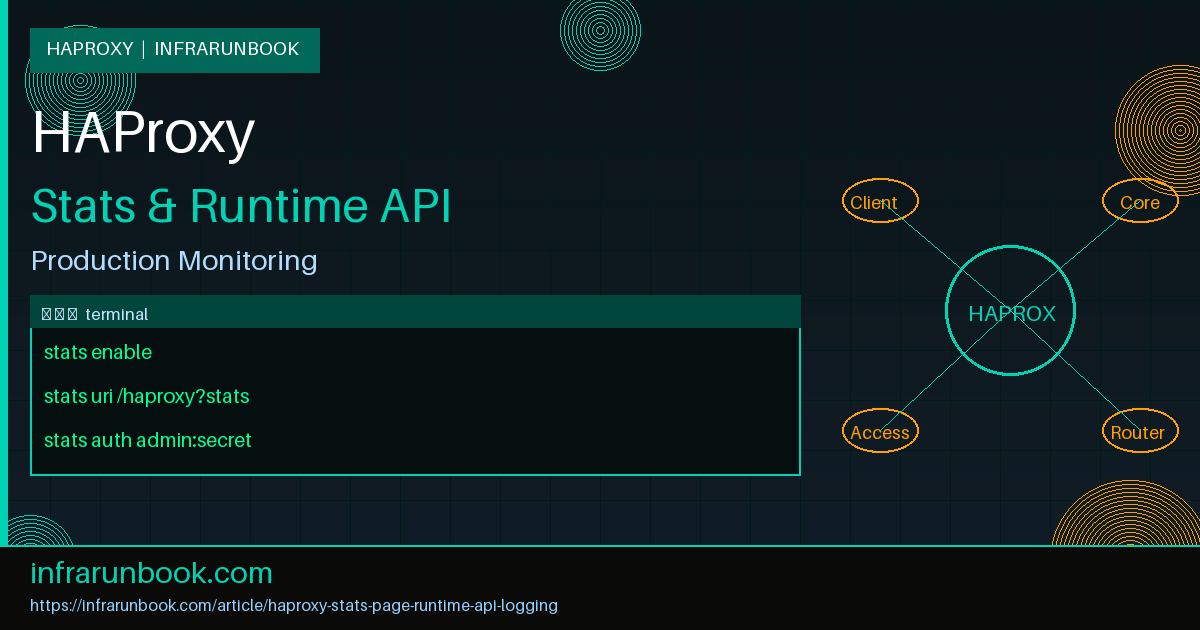
Enabling the Built-In Stats Page
The stats page is exposed as a dedicated frontend listener. Best practice is to bind it to a management interface IP rather than the public-facing address, and to protect it with HTTP basic authentication at minimum.
frontend stats
    bind 192.168.10.20:8404
    stats enable
    stats uri /haproxy?stats
    stats realm HAProxy-Stats
    stats auth infrarunbook-admin:V3ryS3cur3!
    stats refresh 10s
    stats show-legends
    stats show-node
    stats show-desc "sw-infrarunbook-01 primary LB"
    no log
The stats realm directive sets the HTTP Basic Auth challenge string shown in the browser prompt. stats show-legends adds a color-coded key below the table, stats show-node prints the hostname so you can identify nodes in an active-active cluster at a glance, and stats show-desc adds a free-text banner at the top of the page. Setting no log on the stats frontend prevents monitoring agents and Prometheus scrapers from flooding your access logs with polling traffic.
Restricting Access with ACLs
HTTP Basic Auth protects against casual browsing but does not restrict the network layer. Combining it with a source IP ACL drops unauthorized connections before credentials are ever challenged:
frontend stats
    bind 192.168.10.20:8404
    acl mgmt_net src 192.168.10.0/24
    http-request deny if !mgmt_net
    stats enable
    stats uri /haproxy?stats
    stats auth infrarunbook-admin:V3ryS3cur3!
    stats refresh 10s
    stats show-node
    no log
Any request originating outside 192.168.10.0/24 receives a 403 before authentication is attempted, eliminating credential brute-force exposure from internet-facing interfaces.
Enabling TLS on the Stats Endpoint
For environments where the management network is shared, traversed by third-party tooling, or subject to compliance audits, wrapping the stats frontend in TLS eliminates cleartext credential transmission:
frontend stats_tls
    bind 192.168.10.20:8443 ssl crt /etc/haproxy/certs/solvethenetwork.com.pem
    acl mgmt_net src 192.168.10.0/24
    http-request deny if !mgmt_net
    stats enable
    stats uri /haproxy?stats
    stats auth infrarunbook-admin:V3ryS3cur3!
    stats refresh 30s
    stats show-node
    no log
The PEM bundle must contain the certificate, any intermediate chain certificates, and the private key concatenated in that order. Refer to the HAProxy SSL/TLS Termination article in this series for full certificate assembly instructions.
Understanding the Stats Dashboard
The stats page is divided into three sections: a global process summary row at the top, per-frontend rows, and per-backend rows where each configured server gets its own line plus an aggregated BACKEND totals row. The most operationally significant columns are:
- Status: UP, DOWN, NOLB (graceful drain in progress), MAINT (administratively disabled), or a fraction such as 2/3 indicating how many servers in the backend are currently passing health checks.
- Cur / Max / Limit: Current active sessions, the historical peak since last reload, and the configured session ceiling.
- Bytes In / Out: Cumulative traffic counters since the last process start or stats reset.
- Req / Err: Total requests handled and the count of connection or response errors.
- Wght: The effective server weight used by the balancing algorithm at this moment.
- Chk Fail / Dwntme: Total health-check failure count and cumulative downtime in seconds since last reload.
- Thrtle: Slow-start throttle percentage, non-zero only while a server is ramping up after recovery.
- Rate / Max Rate: Current new-session creation rate per second and the highest rate ever observed.
The dashboard auto-refreshes at the interval set by stats refresh. On very high-traffic nodes with dozens of backends, page rendering can become sluggish. In those cases, reduce the refresh interval to 30s or 60s and rely on the Prometheus exporter for sub-second automated collection.
Enabling the Unix Socket Runtime API
The Runtime API exposes every metric visible on the stats page through a Unix socket interface, and additionally allows live mutation of the running configuration without triggering a reload or dropping existing connections. Enable it in the global section:
global
    stats socket /var/run/haproxy/admin.sock mode 660 level admin expose-fd listeners
    stats timeout 30s
The level parameter controls what operations are permitted on the socket. level admin grants full read-write access including global parameter changes. level operator allows server state mutations (drain, maint, weight) but disallows global edits. level user provides read-only metrics collection with no ability to change state. For a Prometheus exporter socket, use level user. For a deployment automation socket used by CI pipelines, level operator is the right choice.
The socket directory must exist and be owned by the HAProxy runtime user before the process starts:
mkdir -p /var/run/haproxy
chown haproxy:haproxy /var/run/haproxy
Querying the Runtime API with socat
socat is the standard CLI tool for interacting with the socket interactively or from scripts. Install it via your distribution package manager and use it as follows:
# Show process info: version, uptime, maxconn, current connections
echo "show info" | socat stdio /var/run/haproxy/admin.sock

# Dump all statistics in CSV format
echo "show stat" | socat stdio /var/run/haproxy/admin.sock

# Show active sessions with client and server addresses
echo "show sess" | socat stdio /var/run/haproxy/admin.sock

# Show contents of a specific stick table
echo "show table http_backend" | socat stdio /var/run/haproxy/admin.sock

# Show current server states across all backends
echo "show servers state" | socat stdio /var/run/haproxy/admin.sock

# Show current map file contents
echo "show map /etc/haproxy/maps/hosts.map" | socat stdio /var/run/haproxy/admin.sock
The CSV output of show stat begins with a comment line listing all column headers preceded by a hash. This makes it trivially parseable with awk, Python's csv module, or any shell pipeline. The scur column holds the current active session count per server, which is the key metric to poll during drains.
Dynamic Server Management via the Runtime API
The most operationally valuable Runtime API capability is changing backend server state without reloading HAProxy. This is the foundation of zero-downtime blue-green and rolling deployments.
# Gracefully drain a server: new sessions go elsewhere, existing sessions finish
echo "set server web_backend/web01 state drain" | socat stdio /var/run/haproxy/admin.sock

# Immediately disable a server: all traffic stops, existing sessions are dropped
echo "set server web_backend/web01 state maint" | socat stdio /var/run/haproxy/admin.sock

# Bring a server back to fully active
echo "set server web_backend/web01 state ready" | socat stdio /var/run/haproxy/admin.sock

# Reduce a server weight on the fly (useful for canary deployments)
echo "set server web_backend/web01 weight 25" | socat stdio /var/run/haproxy/admin.sock

# Update a server address at runtime without reload (HAProxy 2.4+)
echo "set server web_backend/web01 addr 192.168.20.55 port 8080" | socat stdio /var/run/haproxy/admin.sock

# Reset statistics counters for a specific backend server
echo "clear counters" | socat stdio /var/run/haproxy/admin.sock
A typical zero-downtime deployment script drains the old-generation servers one at a time, polls show stat checking the scur field until it reaches zero for each server, then sets them to maint before deploying the new application version and setting the new servers to ready.
Pre-Declaring Spare Server Slots
HAProxy 2.2 and later support adding entirely new server entries to a backend at runtime using add server, but the more portable pattern is to pre-declare spare slots as disabled in the configuration file and activate them at runtime when needed:
backend web_backend
    balance leastconn
    server web01 192.168.20.10:80 check weight 100
    server web02 192.168.20.11:80 check weight 100
    server web03 192.168.20.12:80 check weight 100 disabled
    server web04 192.168.20.13:80 check weight 100 disabled

# At deployment time, activate a spare slot and point it at the new instance
echo "set server web_backend/web03 addr 192.168.20.12 port 80" | socat stdio /var/run/haproxy/admin.sock
echo "set server web_backend/web03 state ready" | socat stdio /var/run/haproxy/admin.sock
HAProxy Logging Fundamentals
HAProxy logs every connection through the syslog protocol. Log directives live in the global section for system-wide defaults and can be overridden per-frontend or per-backend. The fundamental global configuration for logging to the local system journal is:
global
    log /dev/log local0 info
    log /dev/log local1 notice
The first argument is the syslog destination (a Unix socket path or a UDP address), the second is the syslog facility (local0 through local7), and the optional third argument is the minimum severity threshold. HAProxy generates two distinct categories of log messages: per-connection access logs at info severity, and process lifecycle and health-check events at notice and above. Routing them to separate facilities makes it straightforward to direct them to distinct log files in rsyslog without custom filtering logic.
Remote Syslog Integration
To ship logs to a centralized syslog infrastructure such as rsyslog, syslog-ng, Graylog, or a SIEM appliance, replace the socket path with a UDP address:
global
    log 192.168.10.50:514 local0 info
    log 192.168.10.50:514 local1 notice
HAProxy 2.3 and later also support TCP syslog delivery for guaranteed message ordering and reliability in high-volume environments:
global
    log tcp@192.168.10.50:514 local0 info
On the receiving rsyslog server at 192.168.10.50, create a dedicated drop-in rule file to route HAProxy messages to their own log files:
# /etc/rsyslog.d/49-haproxy.conf
if $syslogfacility-text == 'local0' then /var/log/haproxy/access.log
if $syslogfacility-text == 'local1' then /var/log/haproxy/error.log
& stop
The & stop action at the end prevents matched messages from also flowing through the default catch-all rules and appearing in /var/log/syslog, eliminating duplication.
Enabling Per-Frontend Logging
Defaults can be overridden at the individual frontend level. This is particularly useful when you need to suppress noisy stats-page polling or increase verbosity to debug a specific listener:
defaults
    log global
    mode http
    option httplog
    option dontlognull

frontend web_https
    bind 192.168.10.20:443 ssl crt /etc/haproxy/certs/solvethenetwork.com.pem
    log 192.168.10.50:514 local0 debug   # elevated verbosity for this frontend only
    default_backend web_backend

frontend stats
    bind 192.168.10.20:8404
    no log   # completely suppress stats page access logs
option dontlognull suppresses log entries for connections that transmit no data, which is common with TCP keep-alive probes, network scanners, and certain health-check implementations. option httplog switches HAProxy from the minimal default format to the full HTTP log format that includes request method, URL path, status code, and all timing breakdowns.
Custom Log Format
The default HTTP log format suits most deployments, but production environments often require a custom format compatible with downstream log parsers, SIEM ingestion rules, or structured logging pipelines. The log-format directive provides full control:
defaults
    log-format "%ci:%cp [%trl] %ft %b/%s %TR/%Tw/%Tc/%Tr/%Ta %ST %B %tsc %ac/%fc/%bc/%sc/%rc %{+Q}r"
The key format variables are:
- %ci / %cp: Client IP address and source port.
- %trl: Request receipt timestamp in local time (use %tr for UTC).
- %ft: Name of the frontend that accepted the connection.
- %b / %s: Backend name and the specific server that handled the request.
- %TR: Time in milliseconds to receive the complete HTTP request headers from the client.
- %Tw: Time in milliseconds the request spent queued waiting for a free server connection slot.
- %Tc: TCP connection establishment time to the backend server in milliseconds.
- %Tr: Time in milliseconds from when HAProxy sent the last byte of the request to when it received the first byte of the server response.
- %Ta: Total active session time in milliseconds, from connection accept to final byte sent to client.
- %ST: HTTP status code returned to the client.
- %B: Total bytes transferred to the client including headers.
- %tsc: Two-character session termination state code indicating how and why the session ended.
- %ac/%fc/%bc/%sc/%rc: Concurrent active sessions across the process, frontend, backend, server, and retry count respectively.
- %{+Q}r: The full HTTP request line, enclosed in double quotes.
Capturing Request and Response Headers in Logs
HAProxy can capture arbitrary request and response headers and append them to the log line. This is invaluable for distributed tracing, debugging CDN cache behavior, and correlating HAProxy access logs with upstream application logs using a shared request identifier.
frontend web_https
    bind 192.168.10.20:443 ssl crt /etc/haproxy/certs/solvethenetwork.com.pem

    # Slot 0: capture Host header up to 64 bytes
    http-request capture req.hdr(Host) len 64

    # Slot 1: capture X-Request-ID for distributed tracing correlation
    http-request capture req.hdr(X-Request-ID) len 36

    # Slot 0 (response): capture Content-Type from the backend response
    http-response capture res.hdr(Content-Type) len 64

    log-format "%ci:%cp [%trl] %ft %b/%s %TR/%Tw/%Tc/%Tr/%Ta %ST %B %tsc %ac/%fc/%bc/%sc/%rc %{+Q}r host=%[capture.req.hdr(0)] reqid=%[capture.req.hdr(1)] ct=%[capture.res.hdr(0)]"

    default_backend web_backend
Header capture slots are zero-indexed independently for request and response captures, in the order the http-request capture and http-response capture directives appear in the configuration. Captured headers that are absent from a given request log as an empty string.
TCP Log Format
For TCP mode proxy listeners such as database clusters, SMTP relays, or raw binary protocol services, use option tcplog in place of option httplog. The TCP log format records connection timing, byte counts, and session state but omits HTTP-specific fields:
listen postgres_cluster
    bind 192.168.10.20:5432
    mode tcp
    option tcplog
    balance leastconn
    timeout connect 3s
    timeout client 1h
    timeout server 1h
    server pg01 192.168.20.30:5432 check inter 5s
    server pg02 192.168.20.31:5432 check inter 5s
Prometheus Integration via the Built-In Exporter
HAProxy 2.0.0 and later ship with a native Prometheus exporter module that eliminates the need for an external sidecar process. Expose it on a dedicated management port secured with a source IP ACL:
frontend prometheus
    bind 192.168.10.20:8405
    acl mgmt_net src 192.168.10.0/24
    http-request deny if !mgmt_net
    http-request use-service prometheus-exporter if { path /metrics }
    no log
Add the scrape target to your Prometheus configuration:
scrape_configs:
  - job_name: haproxy
    static_configs:
      - targets:
          - '192.168.10.20:8405'
    scrape_interval: 15s
    metrics_path: /metrics
Key Prometheus metrics exported by HAProxy include:
- haproxy_process_current_connections: Active connections across all frontends at the time of scrape.
- haproxy_frontend_http_requests_total: Monotonically increasing request counter per frontend, suitable for rate calculations.
- haproxy_backend_current_queue: Requests currently queued waiting for a free server connection slot — a leading indicator of backend saturation.
- haproxy_server_check_failures_total: Cumulative health check failures per backend server, useful for alerting on flapping servers.
- haproxy_server_downtime_seconds_total: Cumulative server downtime, useful for SLA reporting.
- haproxy_backend_response_time_average_seconds: Rolling average backend response latency per backend.
- haproxy_server_current_sessions: Per-server active session gauge, used to confirm drains have completed before deployments proceed.
Configuring Log Rotation
HAProxy delegates log rotation to the host syslog daemon. Create a logrotate configuration for the HAProxy log files written by rsyslog:
# /etc/logrotate.d/haproxy
/var/log/haproxy/*.log {
    daily
    rotate 30
    missingok
    notifempty
    compress
    delaycompress
    sharedscripts
    postrotate
        /usr/lib/rsyslog/rsyslog-rotate
    endscript
}
When shipping logs directly to a remote collector such as Graylog, Loki, or an Elastic stack, retention is managed by the collector's index lifecycle or stream retention policies rather than logrotate, and the local log files may not exist at all.
Full Production Configuration Reference
The following haproxy.cfg skeleton consolidates all monitoring and logging components discussed in this article into a coherent production-ready baseline for sw-infrarunbook-01:
global
    log 192.168.10.50:514 local0 info
    log 192.168.10.50:514 local1 notice
    stats socket /var/run/haproxy/admin.sock mode 660 level admin expose-fd listeners
    stats timeout 30s
    maxconn 50000
    user haproxy
    group haproxy
    daemon

defaults
    log global
    mode http
    option httplog
    option dontlognull
    option forwardfor
    timeout connect 5s
    timeout client 30s
    timeout server 30s
    log-format "%ci:%cp [%trl] %ft %b/%s %TR/%Tw/%Tc/%Tr/%Ta %ST %B %tsc %ac/%fc/%bc/%sc/%rc %{+Q}r"

frontend web_http
    bind 192.168.10.20:80
    redirect scheme https code 301

frontend web_https
    bind 192.168.10.20:443 ssl crt /etc/haproxy/certs/solvethenetwork.com.pem alpn h2,http/1.1
    http-request capture req.hdr(Host) len 64
    http-request capture req.hdr(X-Request-ID) len 36
    default_backend web_backend

backend web_backend
    balance leastconn
    option httpchk
    http-check send meth GET uri /health ver HTTP/1.1 hdr Host solvethenetwork.com
    http-check expect status 200
    server web01 192.168.20.10:80 check weight 100
    server web02 192.168.20.11:80 check weight 100
    server web03 192.168.20.12:80 check weight 100 disabled

frontend stats
    bind 192.168.10.20:8404
    acl mgmt_net src 192.168.10.0/24
    http-request deny if !mgmt_net
    stats enable
    stats uri /haproxy?stats
    stats auth infrarunbook-admin:V3ryS3cur3!
    stats refresh 10s
    stats show-node
    stats show-legends
    no log

frontend prometheus
    bind 192.168.10.20:8405
    acl mgmt_net src 192.168.10.0/24
    http-request deny if !mgmt_net
    http-request use-service prometheus-exporter if { path /metrics }
    no log